
Ever heard “What room are we in” during a BIM Coordination meeting? The current status quo involves either appending floor plan CADs to each level, or using a “3D Room Name” family that must be applied to Revit design models using an add-in or Dynamo script.
That may work great as a visual reference inside Navisworks, but what about for reporting clash data? Say you want to tie a room name to a clash point location, so when producing clash reports, the user can identify the room where each clash occurs, and have a visual aid.
Making clash reports more consumable helps convey clash information more efficiently, strengthens your clash tracking process, and aggregates Navisworks clash data in a more analysis-friendly format. Watch the video, and/or read the post.

The Role of Data & the AECO Industry
Let’s zoom out for one minute. You may have heard the phrase “data is the new oil.” Think about that for a second. No matter your feelings on oil, a global commodity that sustains (for now) the modern world is being outpaced by bits and bytes.
Not hard to imagine when you think about Bitcoin. But how about big data; how do gigabytes of demographic information, location, and interests translate into a product that fetches more than $2.86 a gallon?
Well, what do we do when given data? We analyze and optimize, looking for the best, the worst, the quickest, slowest, cheapest, prettiest, or loudest data we can and say “Here, this is where we double our efforts, and this is where we cut our losses.” We use data to make better decisions, drive growth, reduce waste, avoid pitfalls… We could generically say data’s value lies in how it is wielded to better achieve goals and minimize obstacles.
The AECO industry is sitting on an oil well of building data. Unfortunately, there are not many refineries around to process this data into actionable insights. Collecting, refining, and presenting company data is nothing new, but the mass adoption of BIM and connected workflows is a relatively recent paradigm shift. It makes sense we are still trying to figure out how mold and wield our data.
One way to get started is using data readily available in standard formats to minimize the time spent cleaning and refining. Navisworks Clash Reports fit this purpose quite nicely. Not to mention, solving clash issues faster can lead to very tangible results (all the benefits you’ve heard before, faster schedule, etc). We’ll start our data dive here.
The Navisworks Clash Report
I have been using Navisworks going on six years now and since day one, reporting clashes after meetings has always left something to be desired. Re-routing clashes is a very visual exercise, cutting sections, taking measurements, and looking around the Navisworks model for unused plenum space.
The most common gripe I have with native Navisworks reports is a single viewpoint cannot convey enough information to the end-user who is trying to solve a clash. So you could spend time during the meeting coming up with solutions, but if those solutions are not reported and tracked in a useful manner, your coordination process can become disorganized and drag on much longer than needed.
There are plugins to assist reporting and tracking, but all demand additional cost, installation, and training. Understandable, to be sure, but it just feels like this isn’t the best solution we can come up with as an industry. Especially when it feels like we already tape together a plethora of different software from different vendors to achieve daily tasks.

With that in mind, I started to experiment with clash report data in Dynamo Revit and Excel—common tools that most in the industry will have access to. I feel there is can potentially be a wealth of information in the standardized clash reports that could be used for future predictive analytics and high-level design and construction strategy planning.
But we’re not quite there yet, so lets start with some basics. If you have been in a clash coordination meeting, I would bet my shirt you have heard the question “where are we in the model?”. Seems like a simple enough problem to solve with some data, especially when our clash reports already have the XYZ coordinate information where clashes occur.
Why Dynamo Revit is Used
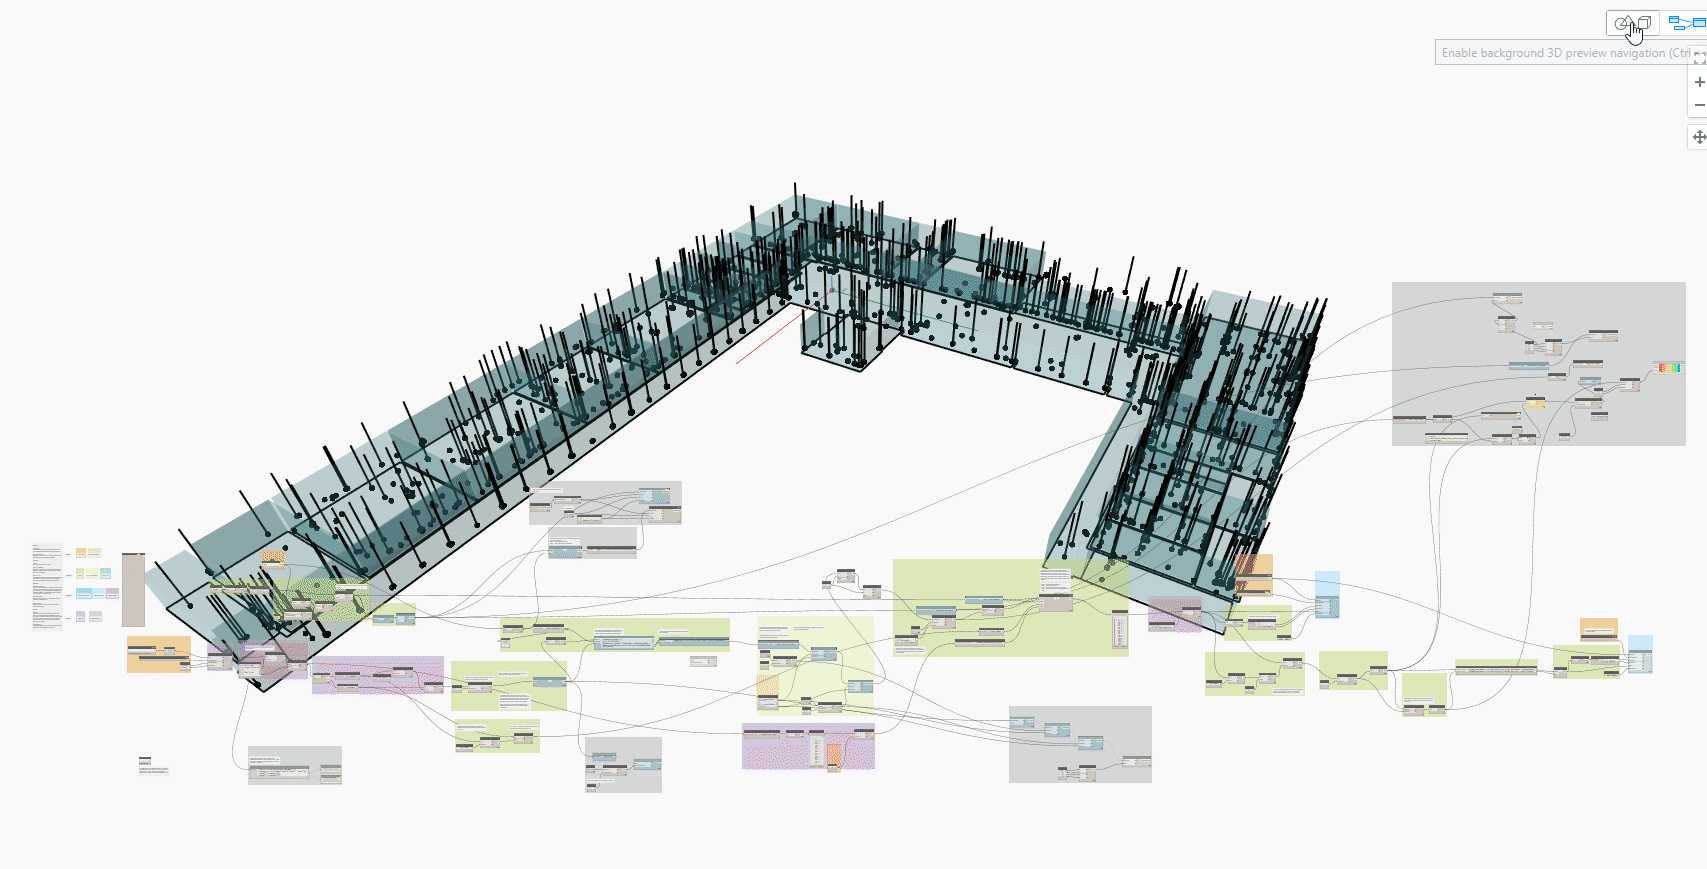
I use Dynamo Revit to easily collect all the Room element that natively exist within the design model. The room elements are converted to solid geometry in Dynamo. Using these solids in conjunction with a Geometry.DoesIntersect node will determine if a clash XYZ point is within a room.
I wanted to create this script without relying on external Dynamo packages so it can be distributed with minimal headache. To accomplish this, I leaned into Python nodes to accomplish some tasks, especially when iterating through nested lists. For me, I find it a bit easier to keep track of inputs and outputs rather than mess with lacing and list levels via Dynamo nodes.
Once the Revit room elements are collected, the rest of the data shaping can theoretically occur outside of Dynamo. If Dynamo is running smoothly and not taking a huge amount of time, though, I see no reason to complicate the workflow. So we will stay in Dynamo to start shaping our excel data.
The Workflow:
If you are searching for an in-depth look at the workflow I used, you’ll have to watch the YouTube video—there is just too much to cover in a blog post.
As for how to use the script, it goes like this:
Open Navisworks, export a clash report as an HTML (Tabular) file.
Open the saved HTML file in Excel and save as a .XLSX
Open the Revit design model with Room information in it (usually the architectural model), make sure internal coordinates align to the Navisworks model.
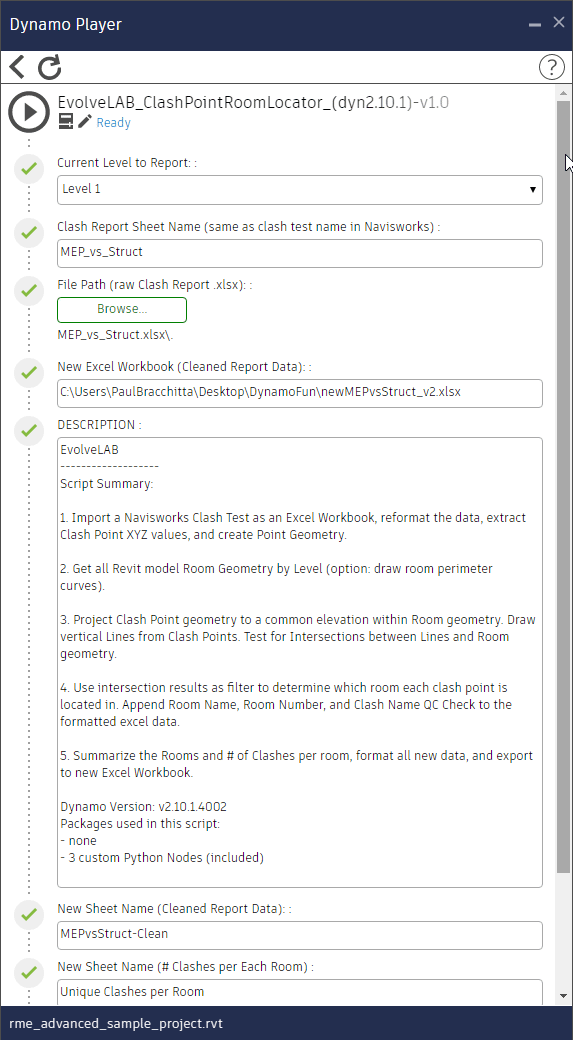
Run Dynamo Player, point to the folder with the script, and enter the inputs in the player dialog.
A resulting Excel file should be created, now containing a column of Room Names appended to each row of clash information.
The newly shaped excel document isn’t more legible than the native Navisworks report; in fact, I find the raw Navisworks report easier to understand as a human.
But we are aiming to use our newly shaped data to create an even better method of reporting. We can start to create a visual glimpse into our new data by using simple Excel features: Conditional Formatting and Charts.


With more easily consumed visuals like these, we can start to analyze the health of our coordination scope of work. For instance, it’s readily apparent that the Corridor on Level 1 is very crowded and throwing many clashes; we’ll need to review this area in much more detail. On the flip side, we can probably leave the WC Room for later, as it doesn’t appear to have too many clash issues. The Elevator Room, though, we’ll want to check that out—despite only having 16 clashes, we can’t afford to have any conflicts with elevators.
Also note, there is a large number of clashes that fall within <no room>. A quick visual inspection of the dynamo geometry and we can see why: there are many clash points situated between rooms, which means these are clashes with wall objects. Usually this is a case of a horizontal system penetrating wall geometry in the model. Totally normal, many times not a real issue but still throws a “false positive” clash. However, sometimes these penetrations are real issues, but how do we know where and when? Well, we now have a dataset of 398 clashes we can assume are wall penetrations, but need a better look to be sure.
Next Steps?

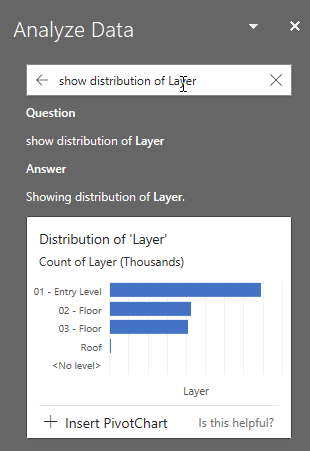
A super cool feature in Excel that I’ve recently become privy to: Analyze Data. This automated analysis tool is great for quickly playing around with your newly-shaped data set. You can type in queries in plain English and the tool will attempt to interpret your question and give you the data-driven results.
This will help determine what data you want to use and which charts you want to create. Some quick examples I used when playing around:
With our script setting the foundation for analyses like this, we can add additional functionality to focus on those 398 “potential issues” that fall outside a room boundaries. This is no different than what we would do inside Navisworks, but now we have a better picture of a problem’s magnitude and can plan for solutions in a more organized manner.
And that is the whole point. We are attempting to get a better handle on the data available at our fingertips. Because leveraging our data will better show us how we can improve as a value-adding company and industry as a whole.
We know this as fact because the AECO industry has been fortunate to witness other industries undergo their own tech revolutions. We have the opportunity to learn from the mistakes other industries have made. We can dictate a better built environment for humanity, one that uses less energy to operate and less waste to build. But first we have to refine our data oil into fuel that can drive these aspirations over the finish line.
For me, at least, the mission starts with something as simple as “what room are we in?”
Subscribe to our channel for more videos produced weekly! Be sure to Like if you found it helpful, or Leave a Comment if you are looking for more.
About the Author

Paul Bracchitta
Senior Construction Technologist
Paul joins us from the construction side of the industry as a Senior Construction Technologist and passionate BIM proponent. Having spent the last 5 years working for multiple general contractors’ BIM departments across the nation, Paul brings with him MEP coordination, Dynamo scripting, laser scanning and contracting experience. He received the Associated General Contractor’s Certificate of Management in BIM in 2017 and has leaned into implementing process changes ever since.
Pursuing his life-long goal of becoming an architect, Paul spent half of his Carnegie Mellon University education as an Architecture student before switching to Civil & Environmental Engineering. The idea: be a better designer by knowing how to engineer and construct buildings. Once he saw the inefficiencies between design, construction, and ownership, Paul knew a better solution was out there and found his niche in BIM, combining data from all stakeholders into a virtual building environment.
A 7th generation Vermont native, Paul has enjoyed exploring our nation, having lived in Pittsburgh and Maryland before moving to Colorado (after a single weekend visit!) for its beautiful terrain and weather. He may be found doing a range of activities, from fishing for trout in the Rockies, enjoying concerts, to a rigorous evening of strategy games with friends.